
The Youth Brand Health Scorecard

A Self-Assessment Tool for Measuring Your Brand's Relevance to Gen Z & Millennial Markets

How to Use This Scorecard
Rate each statement on a scale of 1-5:
Be honest when evaluating each item. This is an internal diagnostic tool meant to help you identify areas of strength and weakness in reaching the youth market.
Category 1: Digital Presence & Accessibility
Weight: 20% of total score
Category 1: Digital Presence & Accessibility
Weight: 20% of total score


Category 2: Social Proof & Community
Weight: 15% of total score
Category 2: Social Proof & Community
Weight: 15% of total score
Category 3: Values & Authenticity
Weight: 20% of total score
Category 3: Values & Authenticity
Weight: 20% of total score
Category 4: Content & Communication
Weight: 15% of total score
Category 4: Content & Communication
Weight: 15% of total score
Category 5: Experience & Convenience
Weight: 15% of total score
Category 5: Experience & Convenience
Weight: 15% of total score
Category 6: Personalization & Recognition
Weight: 10% of total score
Category 6: Personalization & Recognition
Weight: 10% of total score
Category 7: Innovation & Trend Awareness
Weight: 5% of total score
Category 7: Innovation & Trend Awareness
Weight: 5% of total score
Your Total Youth Brand Health Score
Score Interpretation
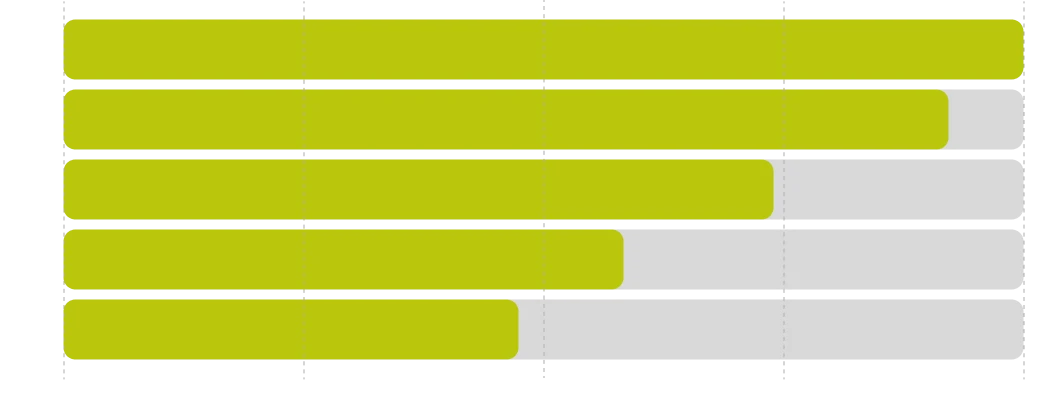
90-100: Youth Brand Leader
Your brand is resonating with younger audiences. Focus on maintaining momentum and staying ahead of emerging trends.
Priority Actions:
- ›Create case studies of your success for content marketing
- ›Expand into new youth-adjacent markets
- ›Mentor other departments/divisions
75-89: Strong Youth Appeal
Your brand is doing well, but has opportunities to improve its approach with younger customers. You are not yet their first choice.
Priority Actions:
- ›Identify your lowest-scoring category
- ›Run A/B tests on solutions to your weak areas
- ›Interview 10 young customers to learn about gaps in your service offerings
60-74: Youth Brand at Risk
Your brand is performing at an average rate. Younger customers can take you or leave you, which leaves your brand in jeopardy.
Priority Actions:
- ›Pick one category scoring below 70 and increase your score
- ›Conduct voice-of-customer research with the youth segment
- ›Audit your competitors’ youth strategies
45-59: Youth Brand Disconnect
Your brand misses the mark with younger audiences. Urgent action is required to discover whether your brand is being avoided or ignored.
Priority Actions:
- ›Stop all youth-targeted marketing until you fix the fundamentals
- ›Hire or consult someone who understands this audience
- ›Start with Categories 1 (Digital Presence & Accessibility) and 3 (Values & Authenticity)
Below 45: Youth Brand Crisis
Your brand could project as outdated to younger customers. Without major changes, your brand will become irrelevant.
Priority Actions:
- ›Consider a complete brand repositioning
- ›Conduct a youth market research sprint
- ›Rebuild from Category 1 up
Deep-Dive Action Plan Template
YOUR LOWEST-SCORING CATEGORY:
CURRENT SCORE: % (Rank: / 7 categories)
- 1.
- 2.
- 3.
Root Cause Analysis
WHY ARE WE WEAK IN THIS AREA?- Lack of budget
- Lack of expertise
- Lack of leadership buy-in
- Wrong team structure
- Not measuring the right metrics
- Other:
Action Item | Owner | Deadline | Success Metric
- 1.
- 2.
- 3.
90-DAY TARGET SCORE FOR THIS CATEGORY: %

Pro Tips for Using This Scorecard

Don’t Score Alone
Have 3-5 people from different departments complete this independently, then compare. You may be surprised to see people from the same company scoring each section differently.

Get Customer Validation
Survey 20-30 customers aged 18-35 with a simplified version of this scorecard so you can get a clear picture of their perception of your brand.

Reassess Quarterly
Youth culture moves fast and your team will need to update their approach along with it. A campaign that worked a few months ago may not work next week.

Stay Focused
Improve your performance in one category before moving onto the next.

Invest Where It Hurts
Start with the category your brand needs to strengthen most.

Bonus: Red Flag Detector
If you scored 2 or lower on any of the items below, start there:
- 1.2 - Our mobile experience is as good or better than our desktop experience
- 3.2 - Our actions align with brand our values
- 3.4 - Brand voice sounds human and genuine
- 4.4 - We use the language our customers use
- 5.5 - Customers see the flow from discovery to delivery as one continuous experience